“Sensor misdirection”
An exploration of unconventional uses of sound in sensing and visualizing the world around us
Built with Adafruit Breakout Microphone Sensors, Arduino, Illustrator, and Processing
For full project documentation, click here.
LOCATING SOUND
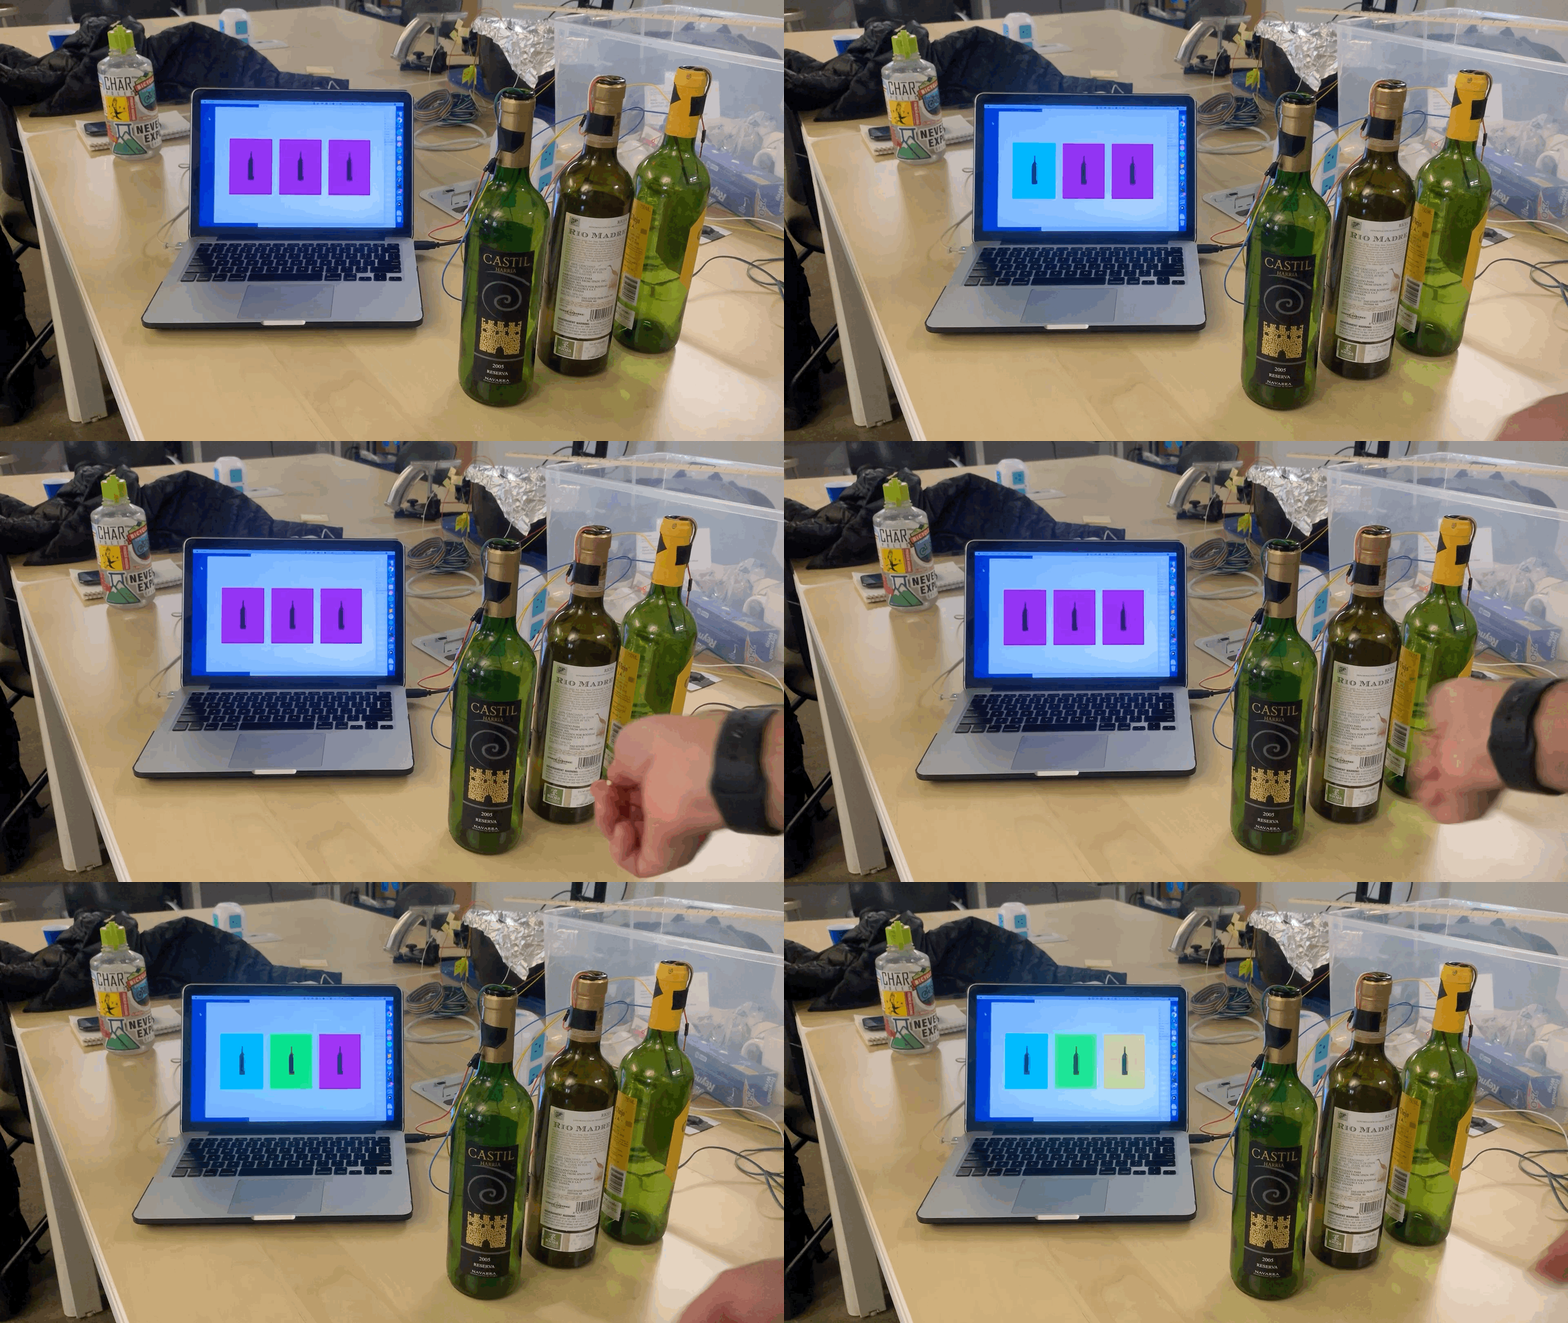
A prototype demonstrating sound as a means of sensing location. In this case, a microphone was taped inside each wine bottle. As the user taps on each bottle, the sensors are “triggered” and our Processing code generates a data visualization that lights up the corresponding bottle.
Background
Through this project, we hope to explore possible physical interactions with an input sensor — the Adafruit Microphone Breakout. Adafruit’s description of the MEMS microphone breakout board notes that these tiny microphones detect sound and convert the input to voltage, with a range of 100Hz to 10Khz, without the need for a bias resistor or amplifier. In order to operate, the microphone must be connected from GND to ground, VIN to 3-5VDC (we only used 3V for this project), and DC signal to A0.
Understanding sound as an input requires a basic understanding of the physics of sound itself. Sound travels in longitudinal, mechanical waves through any medium — gases, solids, and liquids — meaning it can travel through anything except a vacuum. Because sound is a wave, it can be measured in amplitude, frequency, period, wavelength, speed, and phase. In musical terms, we interpret these as volume, pitch, tone, and tempo. A commonly used unit for frequency is the Hertz, where 1 Hertz = 1 vibration/second.
After characterizing the sensors and determining their capacities and limitations (such as directional bias), the challenge then became to use sound in unconventional ways. Eventually, we settled upon six prototypes, briefly outlined below, to depict the range of physical interactions possible with the Adafruit MEMS breakout board. We also hope to demonstrate the extensive potential uses of physical sound interaction in exploring and interpreting the world around us in surprising and unconventional ways.
prototype 1: rainfall
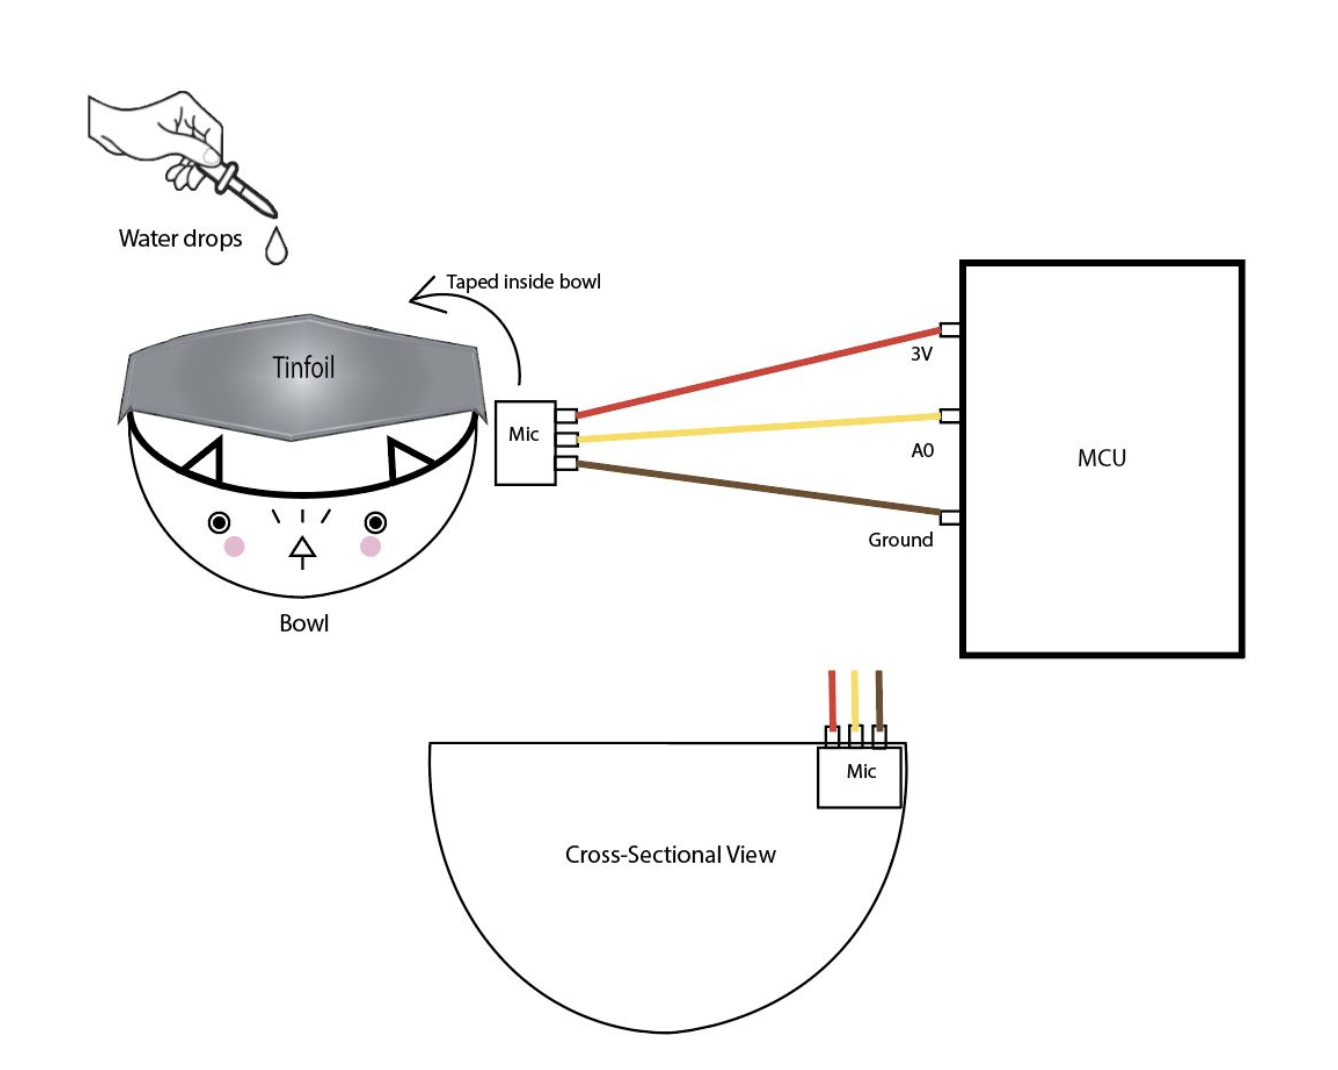
Prototype schematic drawn in Illustrator
For this prototype, we essentially created a rainfall sensor that could determine the sound of water droplets. Falling water emits an organic and familiar sound, with a binary input not dependent on pitch or tone. Mimicking the sound of rainfall on a tin roof, we placed tinfoil over a bowl, with a microphone taped inside. The visualization depicts a sunny day over The Flatirons when no water droplets are sensed, and changes to a rainy day when the user drops water onto the tinfoil.
prototype 2: locating sound
Like the Acoustic Direction Prototype (detailed below), this prototype builds upon the idea of locating origin via sound. In this case, rather than the user manipulating the location of the microphone in relation to the sound source, the microphone is stationary and it is the sound source that varies.
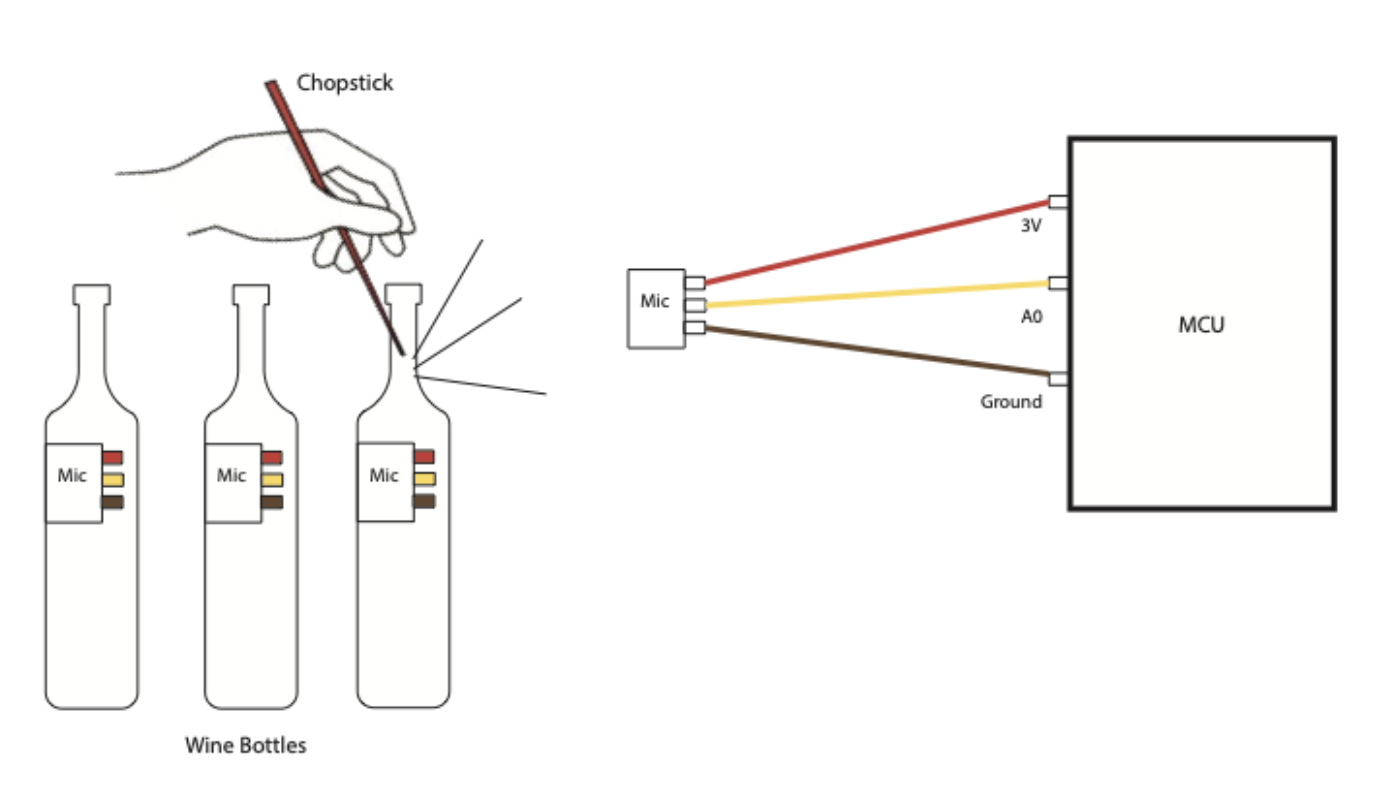
We taped three microphones in separate wine bottles, which the user taps on with a chopstick to trigger the microphones inside. Our Processing code detects which microphone is activated above a baseline sound level, then visualizes this data by depicting three different wine bottles that light up when tapped. The result is a visually and haptically satisfying physical interaction.
Prototype schematic drawn in Illustrator
prototype 3: balloon button
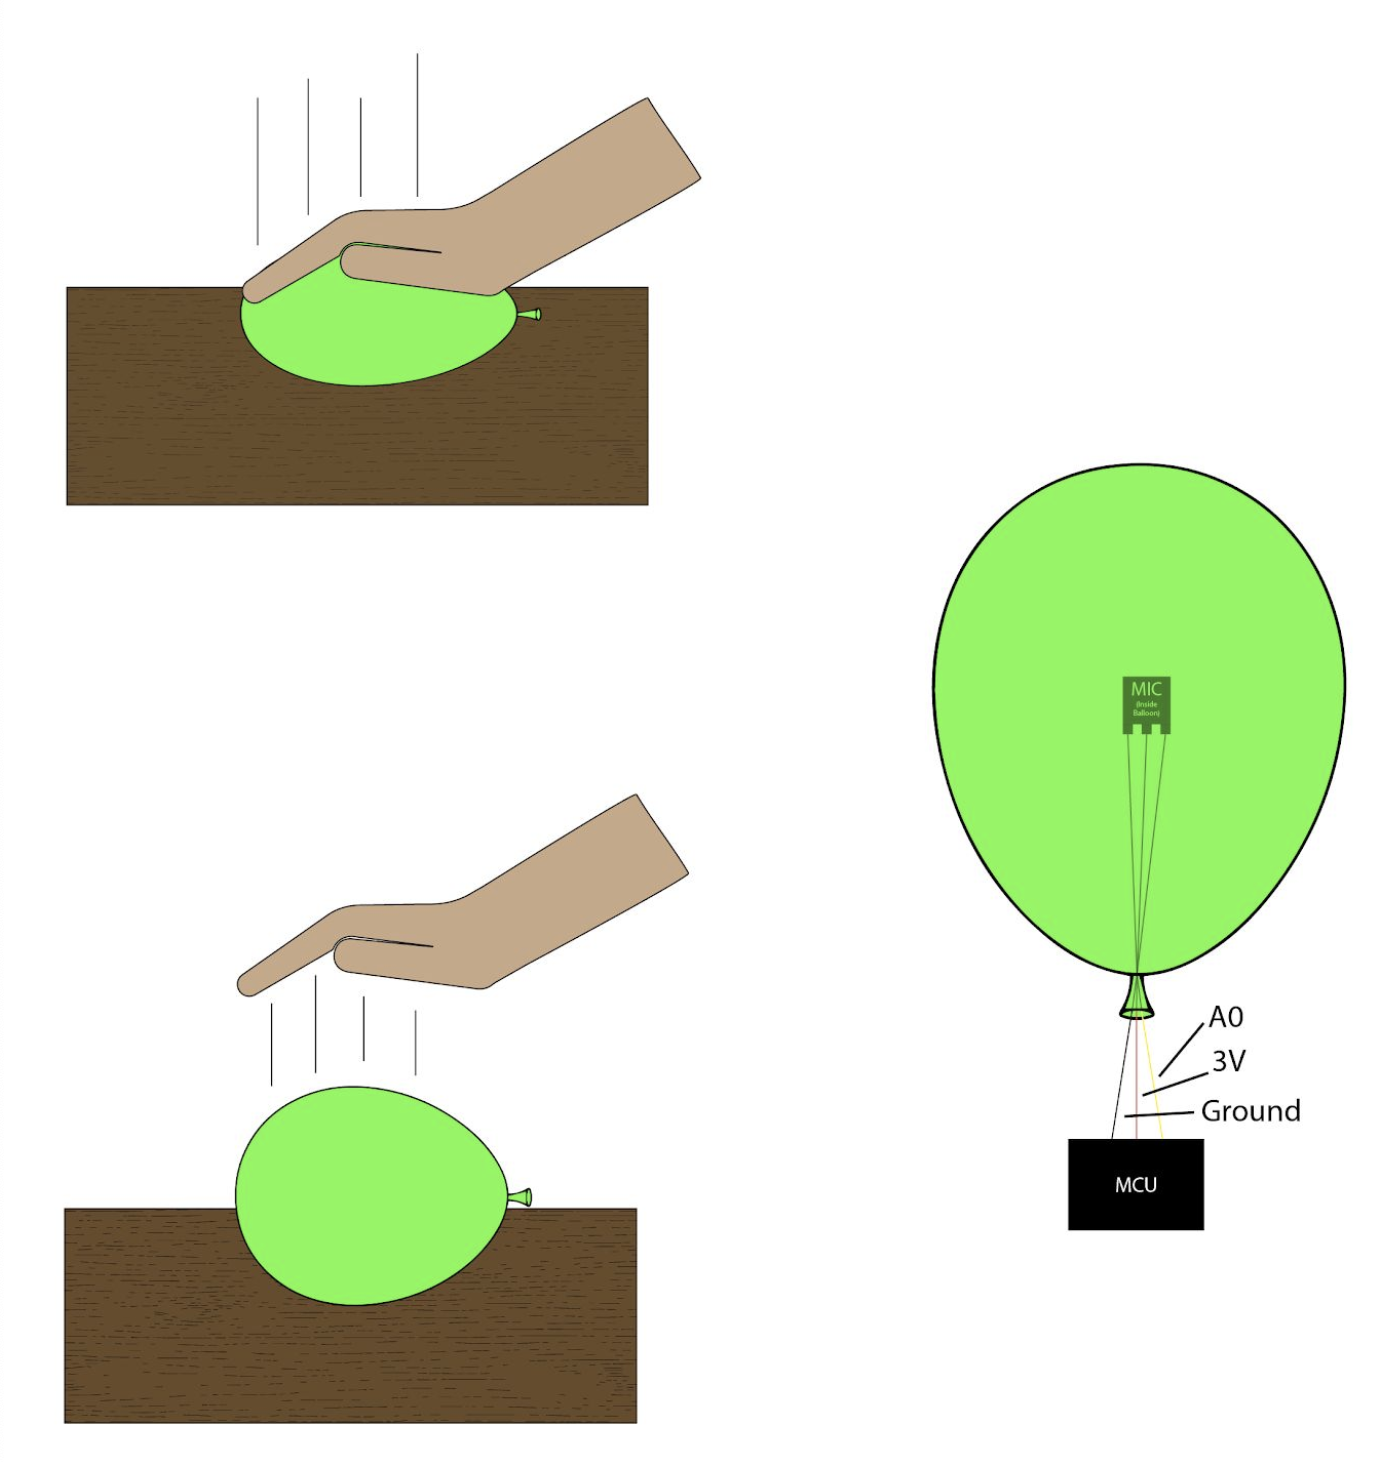
In our initial explorations with the microphones, we quickly determined that the sensors were highly sensitive to air pressure. A microphone, at its most basic function, is just a very responsive pressure transducer. So, we thought to use it as one. The absolute pressure of the surrounding air is filtered out by either a high-pass filter or through the physical construction of the microphone, but it still allows us to see fast changes in air pressure that are at the low end of the acoustic frequency range.
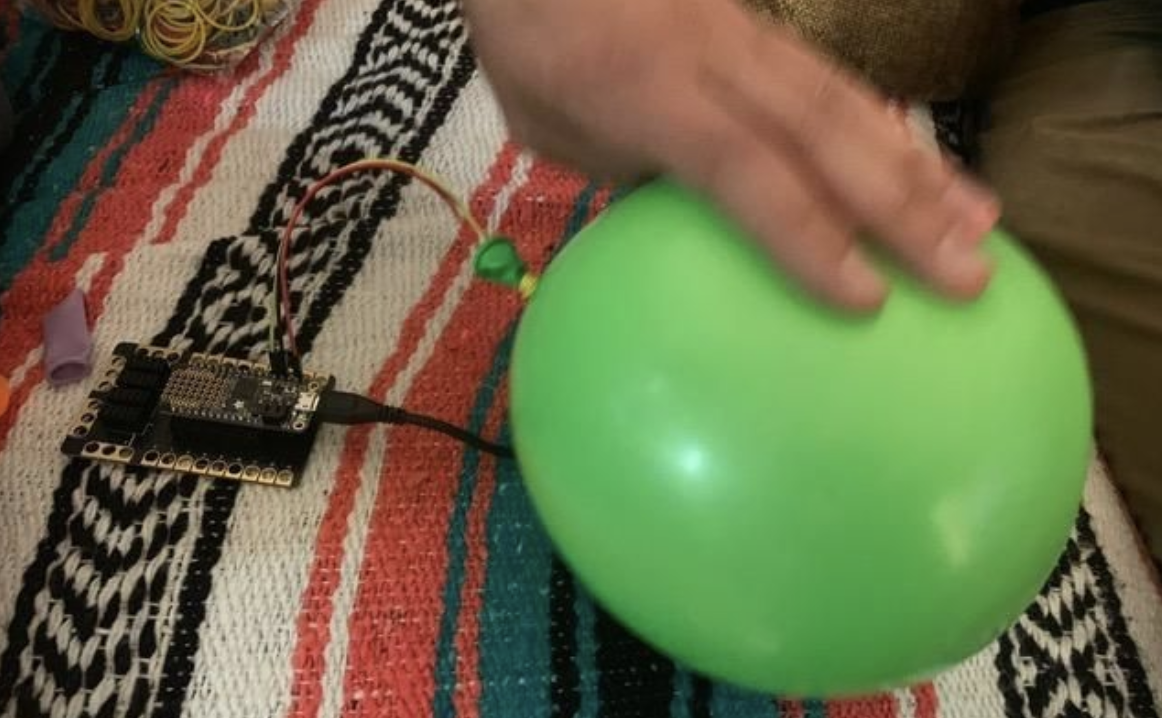
We thought to manipulate air pressure in a tactile sense by using a "button” constructed with a balloon with a microphone placed inside. Our data visualization shows both an increase in air pressure (when the balloon is being pressed) as well as a decrease in air pressure (when the balloon is released). In depicting gradual input data, rather than a binary sensor interaction, the result is a mesmerizing “button,” both visually and haptically.
Prototype schematic drawn in Illustrator
prototype 4: Sound as a measurement of distance
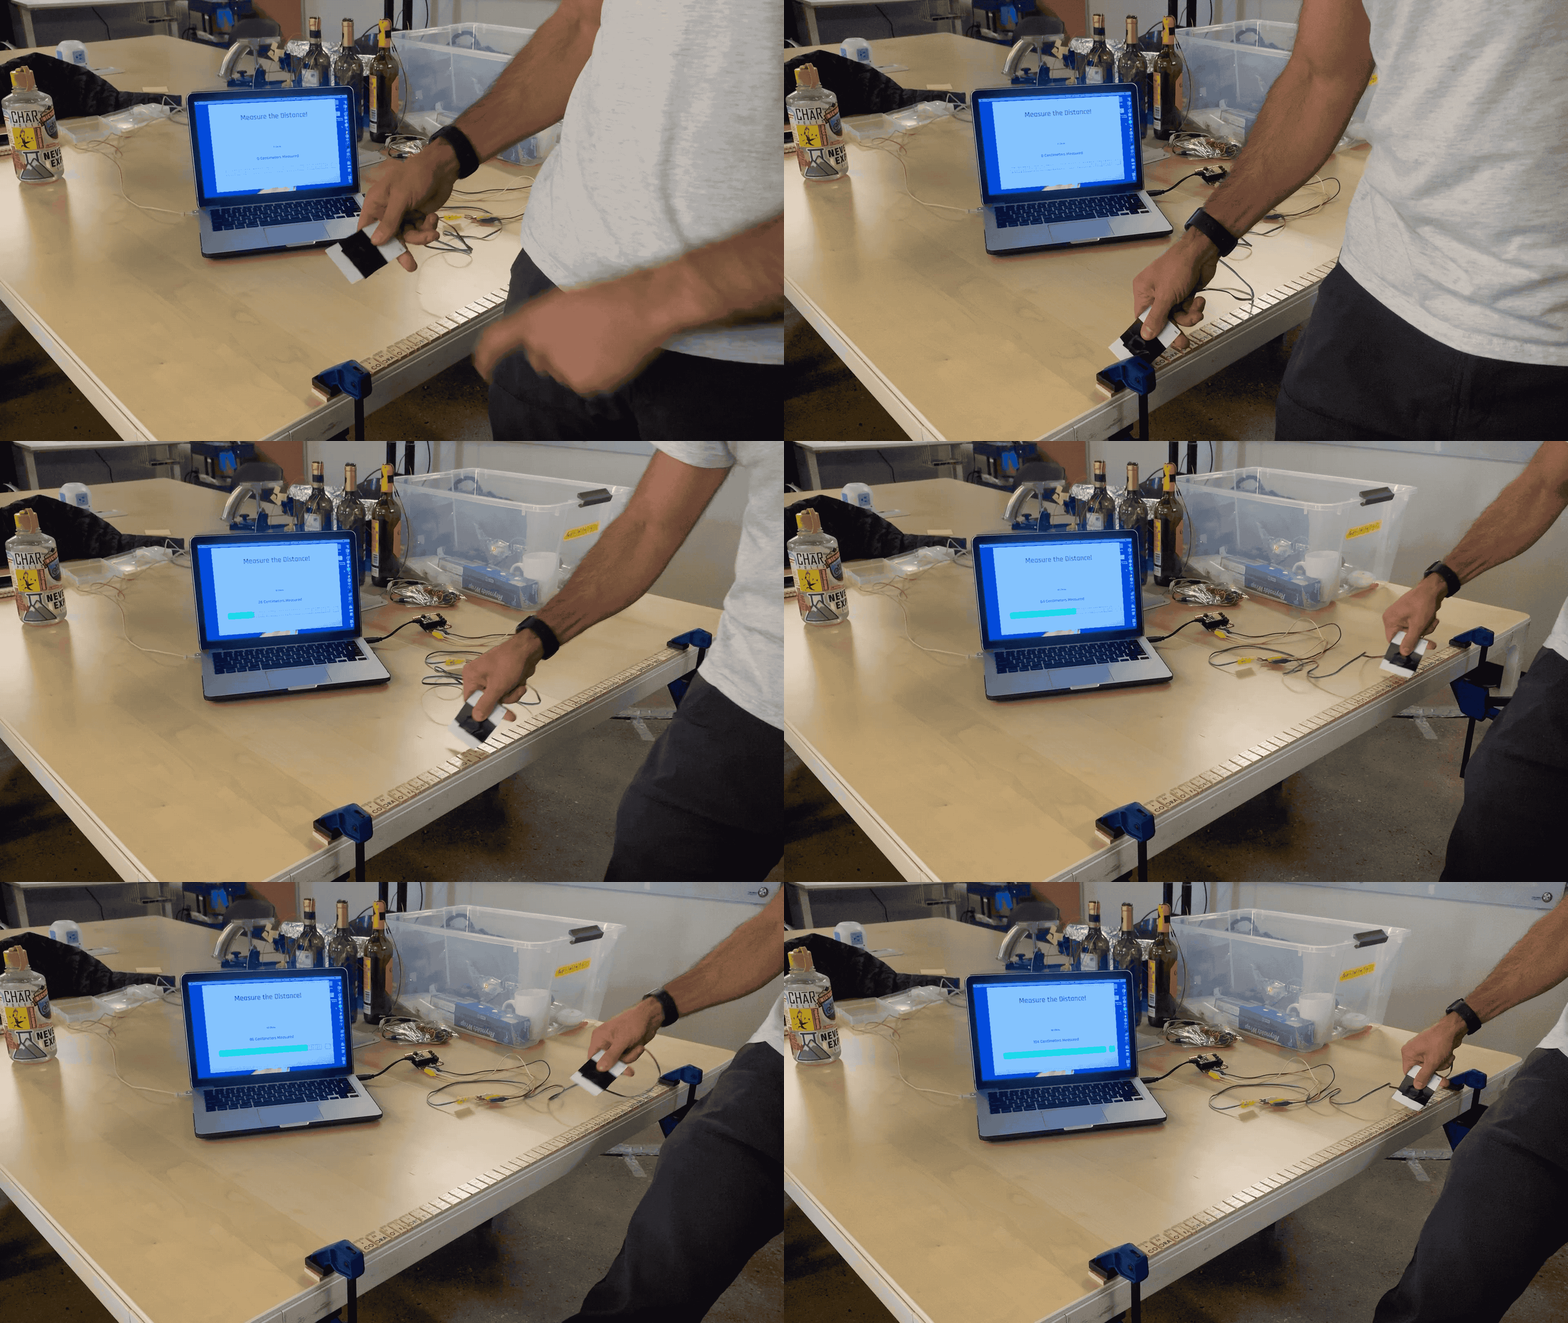
In using sound to determine unconventional data, one idea that compelled us was the use of sound to count or measure, which could be expanded to any number of input variables. Inspired by the design of traffic counters, which utilize pneumatic road tube sensors to send a burst of air pressure along a rubber tube when the vehicle’s tires pass over the tube. The pressure closes an air switch, producing an electrical signal that is then transmitted to a counter or analysis software. We wanted to use spikes of incoming sound data to create a counter, which could determine how many times an event had occurred. Taken further, this count could then be used to measure distance.
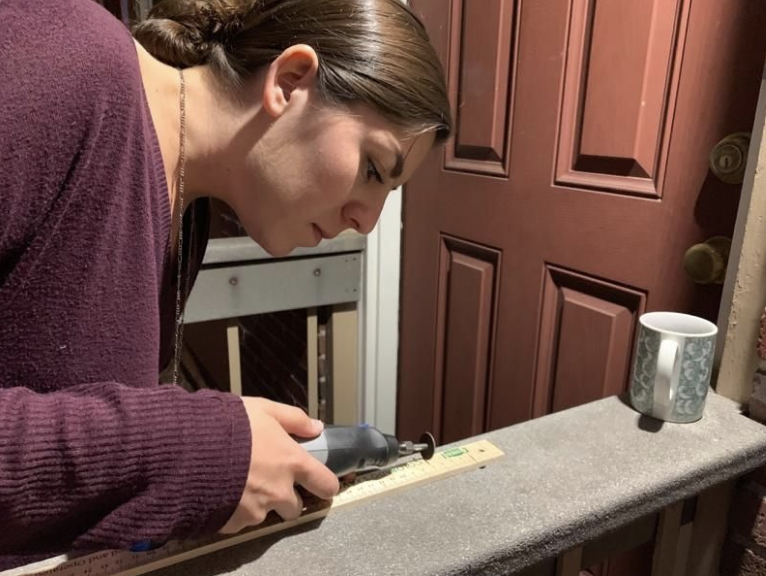
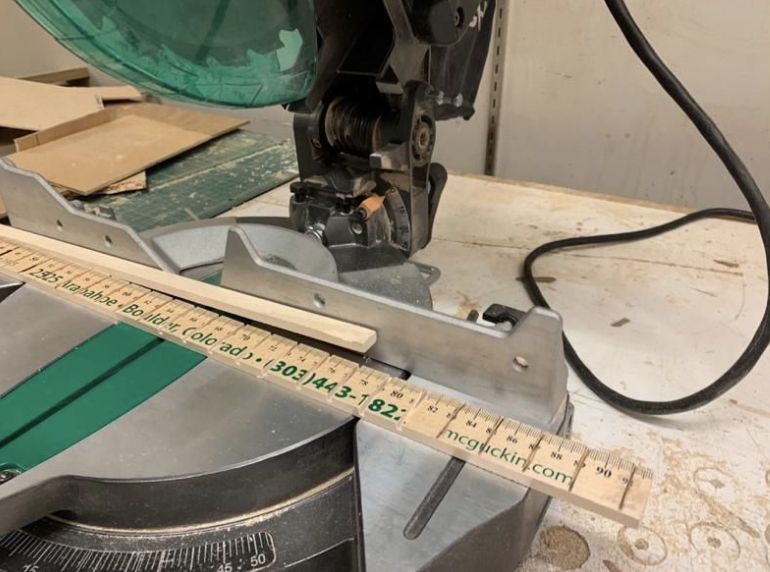
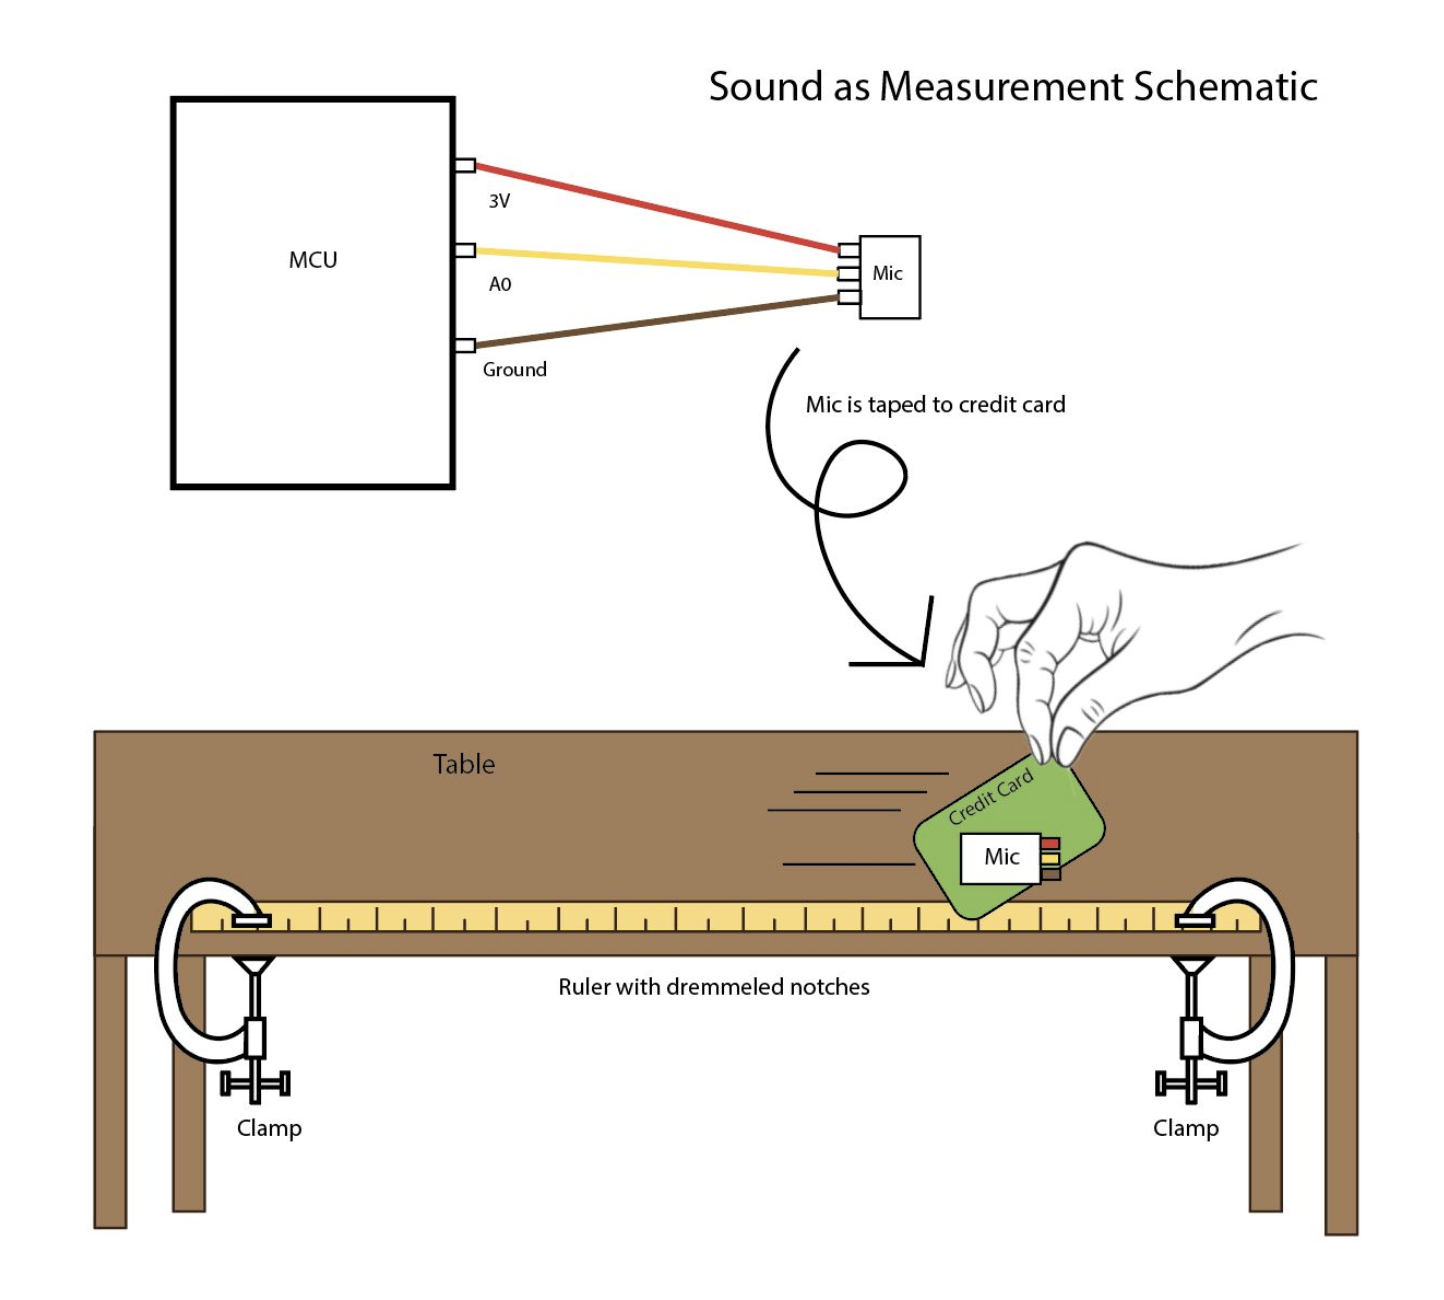
We cut notches into a yardstick using a dremel, which provided a large margin for human error. However, our thought was that the notches would average out over the length of the yardstick. To minimize this error, however, we ended up using a miter saw to clean up the notches.
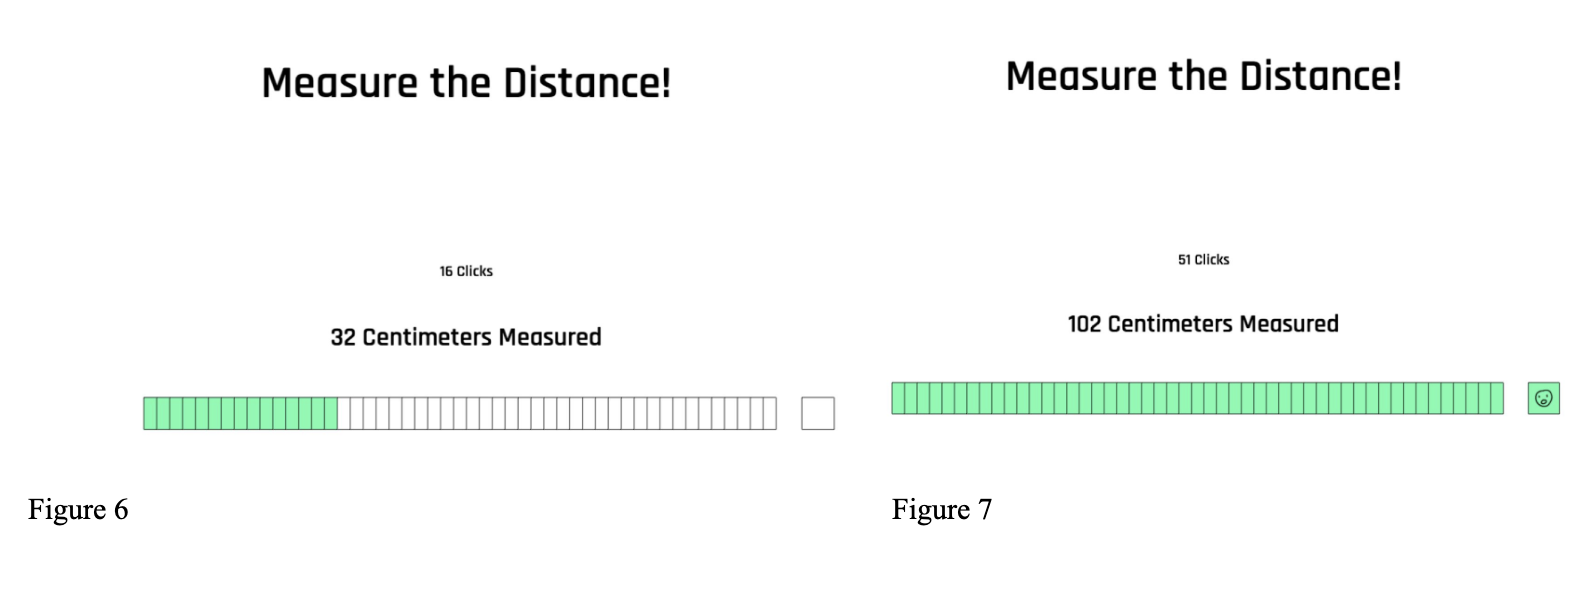
In the finalized prototype, the user runs a card, with a microphone attached, across the notches on the yardstick. Our finalized data visualization uses the number of notches detected by the microphone to determine the number of centimeters measured, and displays a face icon when you have reached the maximum distance measurable.
Prototype schematic drawn in Illustrator
prototype 5: acoustic location
One of the fundamental elements of the microphone sensors is that they are directionally biased rather than omnidirectional. Inspired by the use of acoustic location by animals, such as bats utilizing echolocation, or the military’s use of sonar, radar, and triangulation to locate enemy vessels, we sought to use acoustic location to determine sound origination.
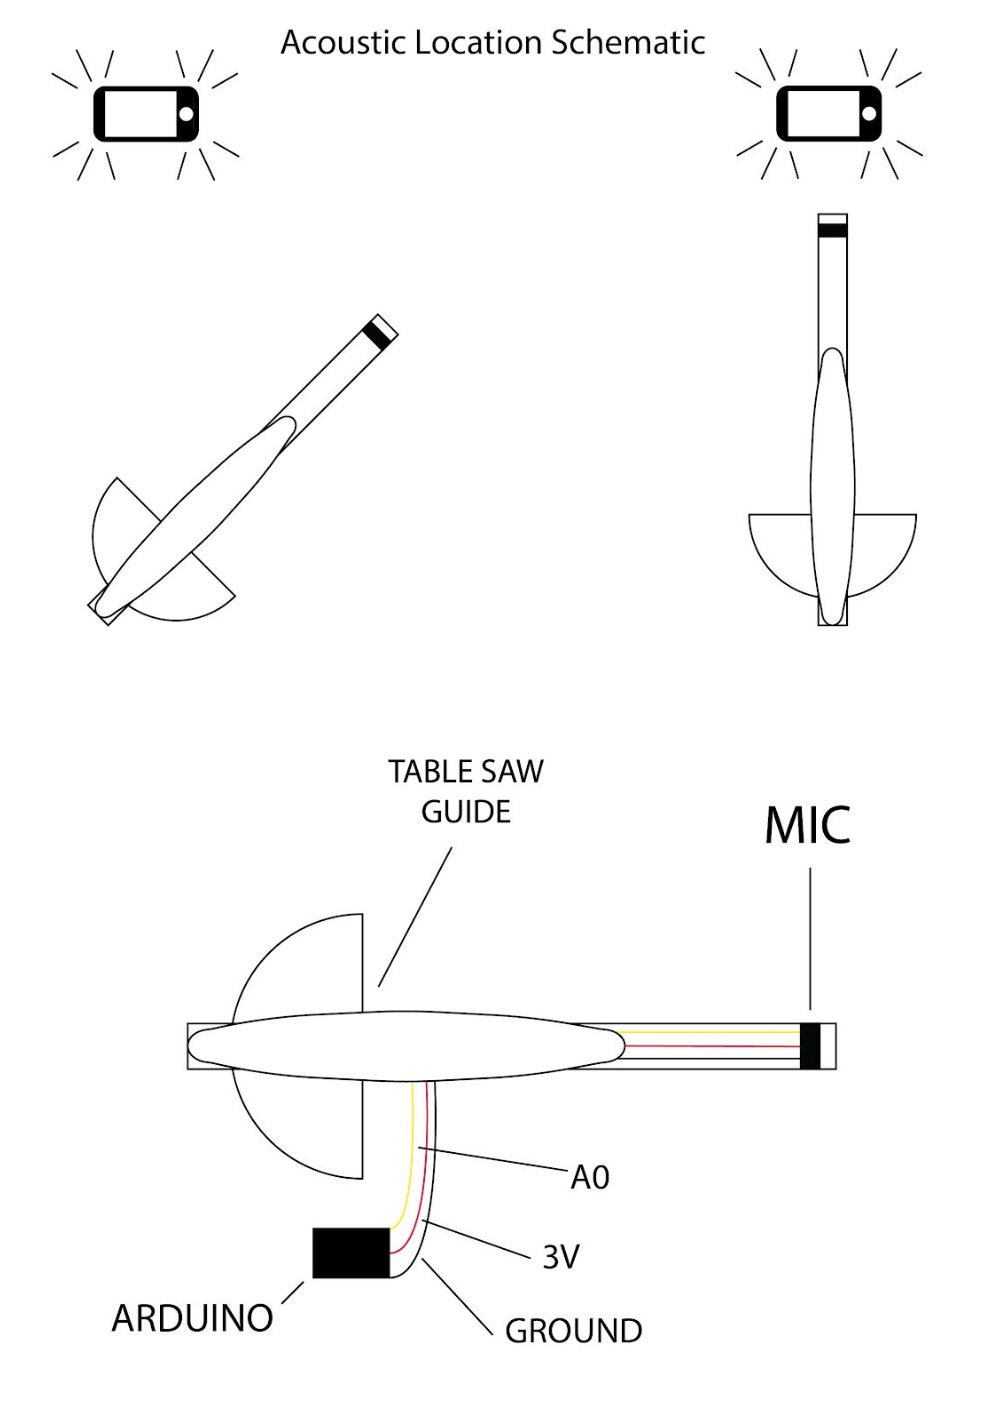
This prototype features a microphone taped to a rotating table saw guide (found on the curbside), with a cellphone emitting a constant metronome. When the user points the microphone towards the emitted noise, our data visualizer displays a goose popping up from the bushes. When the microphone is rotated away, the goose disappears.
Prototype schematic drawn in Illustrator
prototype 6: Hand drumming
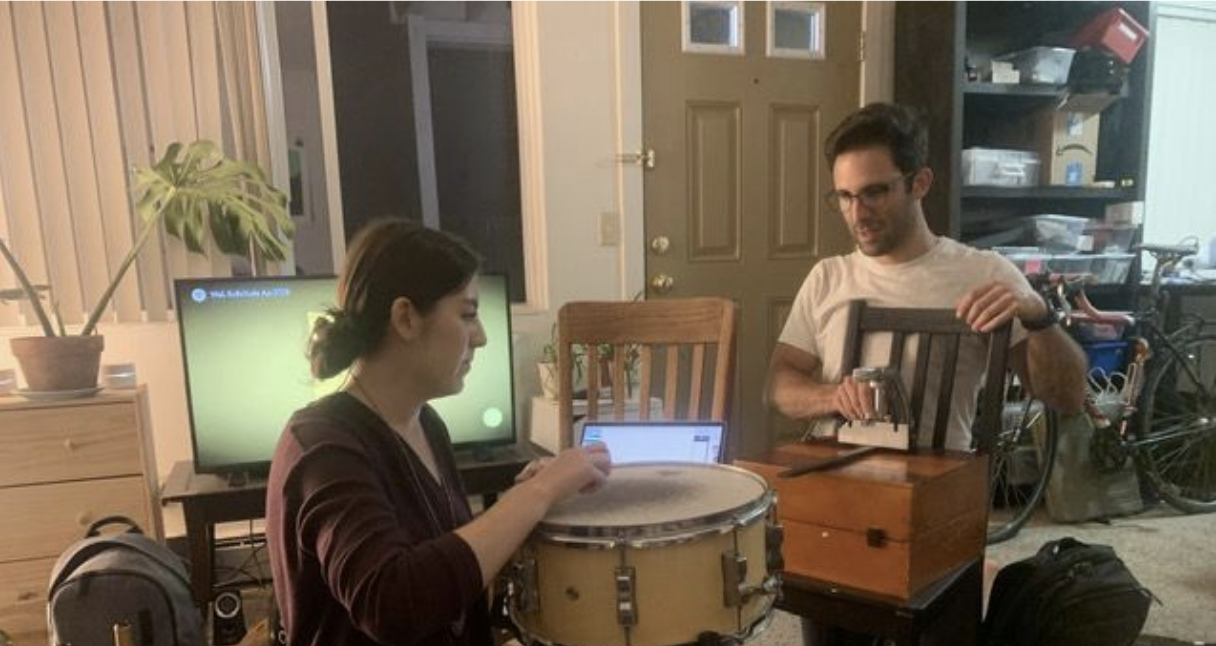
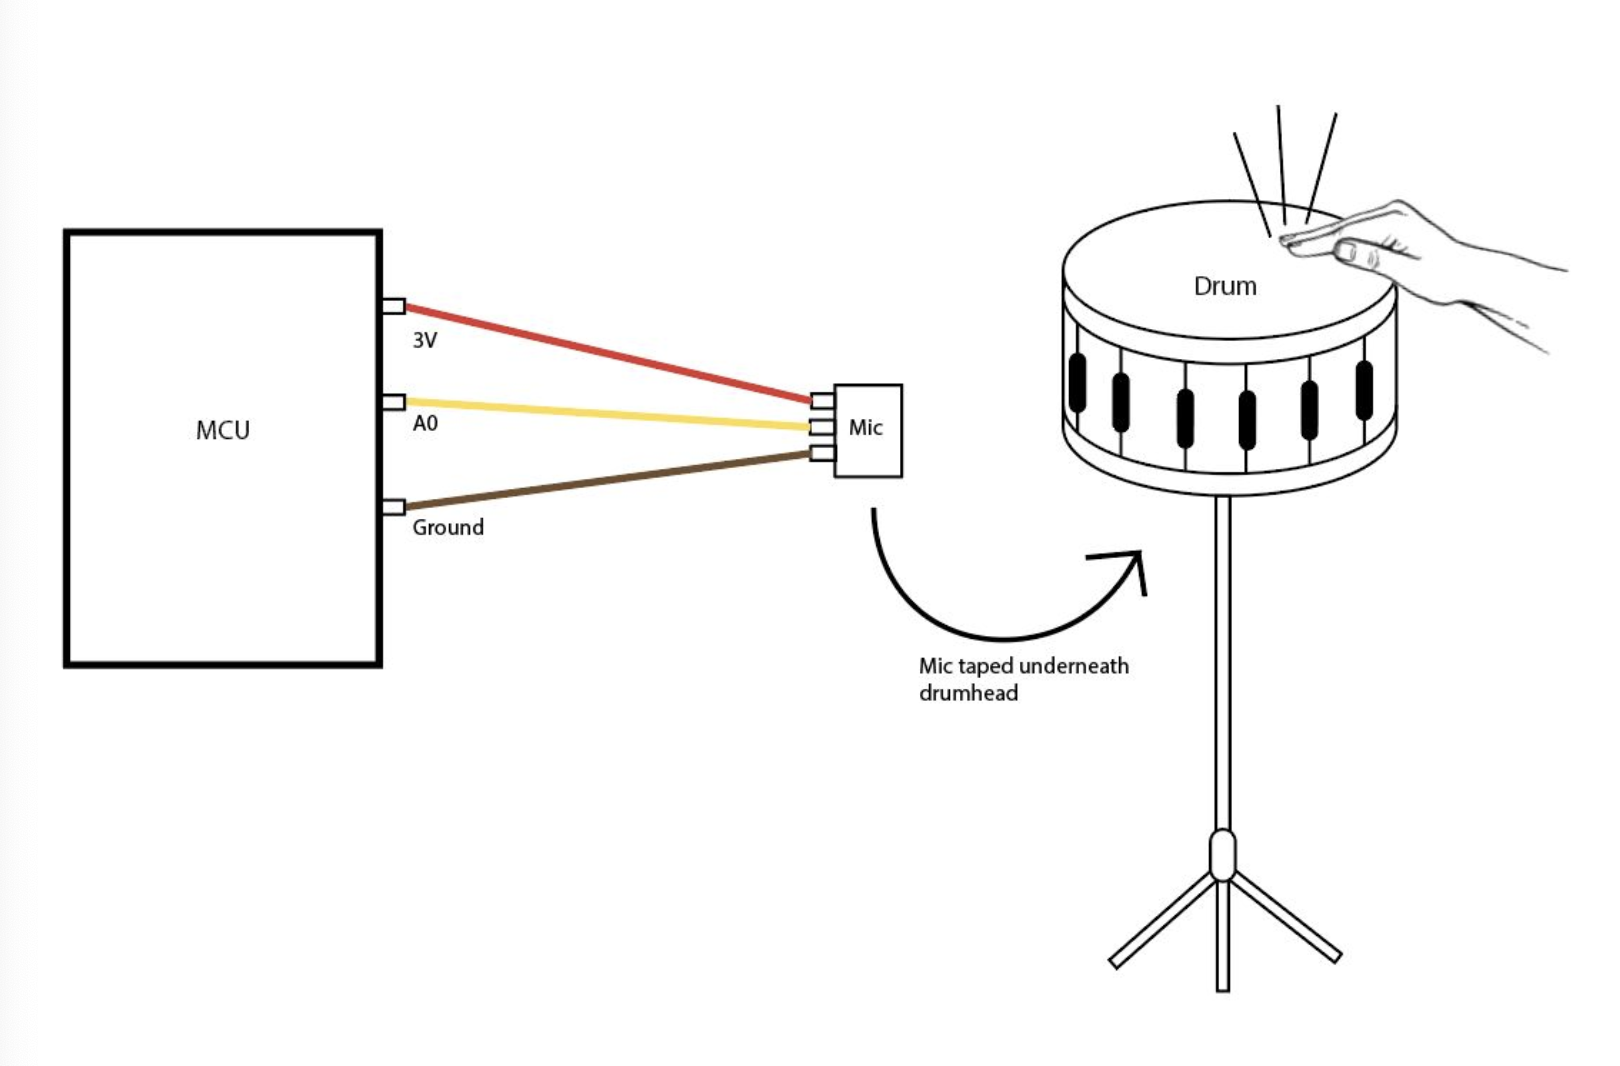
We knew we wanted to use one of the more obvious physical interactions with our sensor: an instrument. One of the simplest instruments, easily played by any user, is a drum. In order to ascertain that the sensor is detecting the drum, rather than ambient noise, we taped a microphone beneath a snare drum. By tapping on the drum, the user triggers the microphone beneath, much like a clicker. The visualizer depicts a snare drum emitting noise if the drum is tapped.
Prototype schematic drawn in Illustrator
